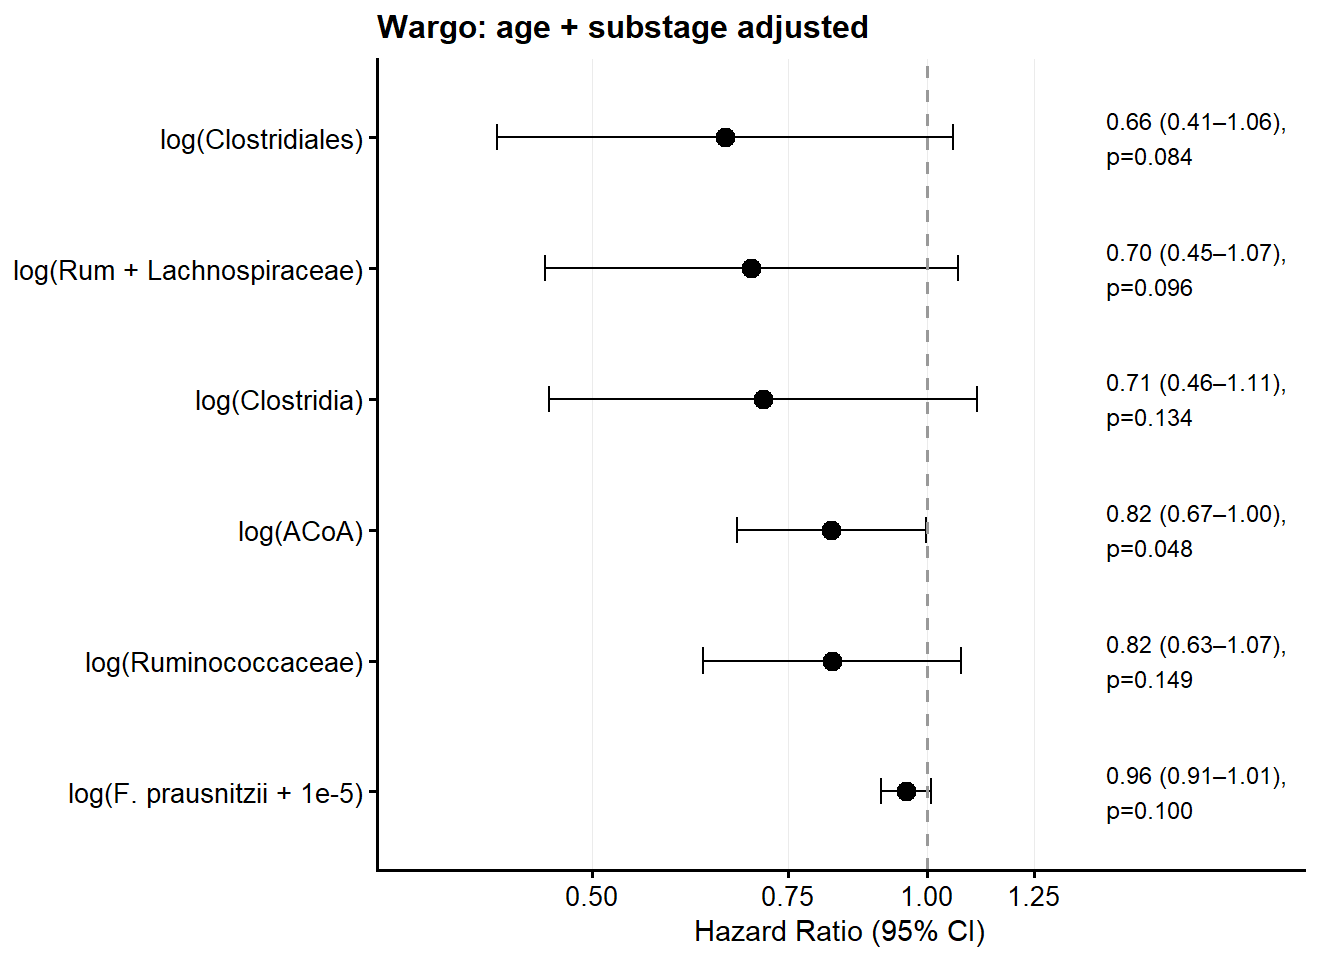
Notes - Multivariable models differ slightly between Wargo and MSK datasets - MSK: adjusted for age (/decade), ECOG, and stratified on histology - Wargo: adjusted for age (/decade) - As described, ECOG is imputed as 1 (median) where not known
ggplot (result_wargos_df,aes (y = fct_reorder (modelname, - HR), x = HR)) + geom_point (size = 3 ) + geom_errorbar (aes (xmin = Lower_CI, xmax = Upper_CI),width = 0.2 , linewidth = 0.5 , orientation = "y" ) + geom_text (aes (x = 1.45 , label = label), hjust = 0 , size = 3.2 ) + geom_vline (xintercept = 1 , lty = 2 , col = "gray60" ) + scale_x_log10 (breaks = c (0.5 , 0.75 , 1.0 , 1.25 ),limits = c (0.35 , 2.0 )) + theme_classic (base_size = 12 ) + theme (axis.text = element_text (size = 10 , color = "black" ),axis.title = element_text (size = 11 ),plot.title = element_text (face = "bold" , size = 12 ),panel.grid.major.x = element_line (color = "gray92" , linewidth = 0.3 ),plot.margin = margin (5 , 15 , 5 , 5 )+ labs (title = "Wargo: age + substage adjusted" ,y = NULL , x = "Hazard Ratio (95% CI)" )
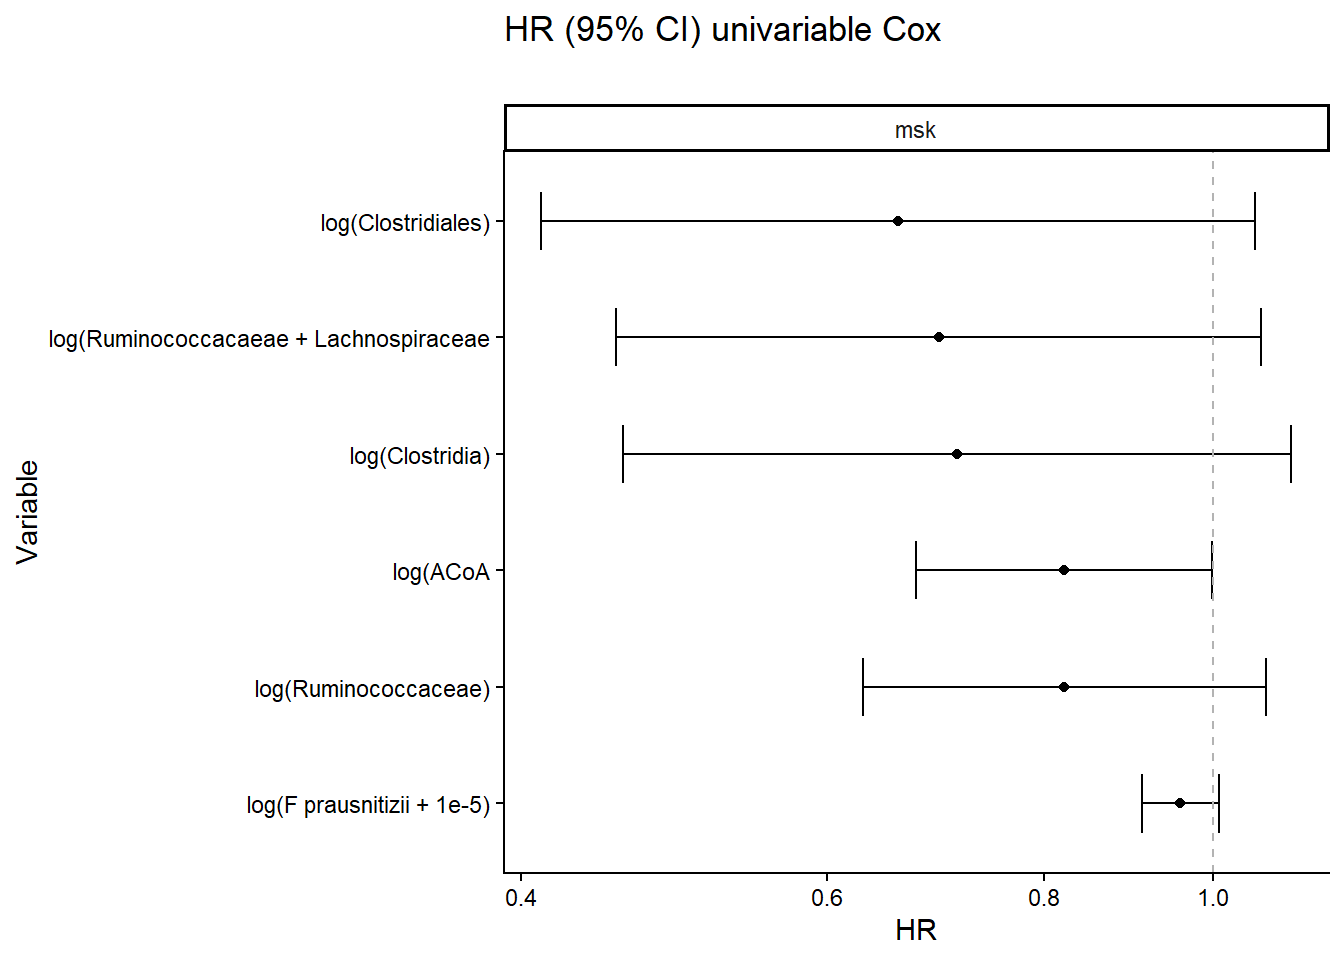
For comparison, here is the same analysis performed on the MSK data:
ggplot (result_msks_df) + geom_point (aes (y= fct_rev (fct_reorder (modelname, HR)), x= HR)) + geom_errorbarh (aes (y= fct_rev (fct_reorder (modelname, HR)), xmin= Lower_CI, xmax= Upper_CI), height= 0.5 )+ geom_vline (xintercept= 1 , lty= 2 , col= "gray70" ) + scale_x_continuous (trans= "log" , breaks = c (0.4 , 0.6 , 0.8 , 1.0 , 1.2 , 1.4 )) + theme_classic () + facet_grid (.~ source) + labs (title = "HR (95% CI) univariable Cox" ,subtitle = "" , y= "Variable" , x= "HR" )